MATLAB:Mod
MATLAB's mod command returns the remainder after division. It is also called the modulo operation (thus, mod).
Examples
Odd or Even?
Among other things, mod is great for determining if a given integer is odd or even. Given
mod(x, 2)
the values returned will be 0 for any even numbers and 1 for any odd numbers.
Periodic Signals
Another great use of mod is taking some range of values and mapping them to a repeating, or periodic, cycle. For instance, imagine you want to graph a Sawtooth wave. Let us call this function \(x(t, A, T)\) where \(t\) is the independent variable, the signal starts at 0 at time 0, and the signal grows to a value of \(A\) by time \(T\). At time \(T\) the signal drops back to 0 and, over the next period, resumes its climb. Start by looking at the result of
y = mod(t, T)
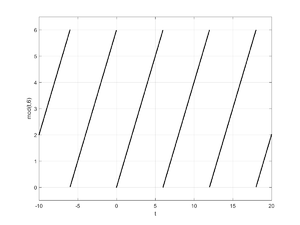
The y value will be the remainder after division with T. For values of t between 0 and T, the function will return exactly those same values. Once t is larger than T however, integer multiples of T will be removed from the t values until all that remains (the remainder) is between 0 and T. Here is some code and a graph demonstrating that for a thirty second span of times from -10 to 20 with a period of 6.
t = linspace(-10, 20, 1000);
y = mod(t, 6);
plot(t, y, 'k.')
axis([-10 20 -.5 6.5])
xlabel('t')
ylabel('mod(t,6)')
grid on
All that is left is to get the amplitude right, and all that requires is multiplying the output of the appropriate mod command by the ratio of A to T, which means our desired function can be written as
x = @(t, A, T) (A/T)*mod(t,T)
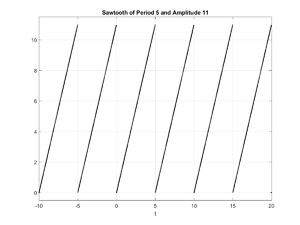
If you want to graph a sawtooth wave with a period of 5 and a maximum amplitude of 11, you could run the following code:
x = @(t, A, T) (A/T)*mod(t,T)
t = linspace(-10, 20, 1000);
plot(t, x(t, 11, 5), 'k.')
axis([-10 20 -.5 11.5])
xlabel('t')
title('Sawtooth of Period 5 and Amplitude 11')
grid on
Shifting
There are two ways you may want to shift the output from a function using mod: you may want to move the series left or right or you may want to move it up or down. For instance, imagine you have a series of increasing numbers:
a = [2 3 4 5 6 7 8 9 10 11 12]
and you want to change this to a repeating integer series that goes from 8 for the first value to 10 for the third and then repeats this pattern. Your first thought would be to use
>> mod(a,3)
ans =
     2     0     1     2     0     1     2     0     1     2     0
This has two problems - it is not starting at the right place and it is not getting to the right values. You first want to create a cycle that starts at 0, climbs to 2, and repeats itself. This is what I mean by shifting things left and right. The easiest way to do this is to simply subtract the first value inside the mod command:
>> mod(a-2,3)
ans =
     0     1     2     0     1     2     0     1     2     0     1
Now the result beings with 0, climbs to its maximum, and repeats this pattern. Next, instead of a range of [0,2], you want a range of [8,10]. Since the span is the same, all you have to do is add 8 after using the mod command:
>> mod(a-2,3)+8
ans =
     8     9    10     8     9    10     8     9    10     8     9
What if you wanted something that went from 10 to 30 instead? You would need to multiply the output of the mod command by the right value to get the span right, then add to it:
>> mod(a-2,3)*(20/2)+10
ans =
    10    20    30    10    20    30    10    20    30    10    20

